Why are some places always hot?
Scroll for prep

Please wait…
This video is having trouble loading. You may have lost your Internet connection.
Step 1: Click to Reload this page
Step 2: Click to
Try our other video player
Step 3: contact support if trouble persists.
Or,
dismiss this message.
DISCUSS:
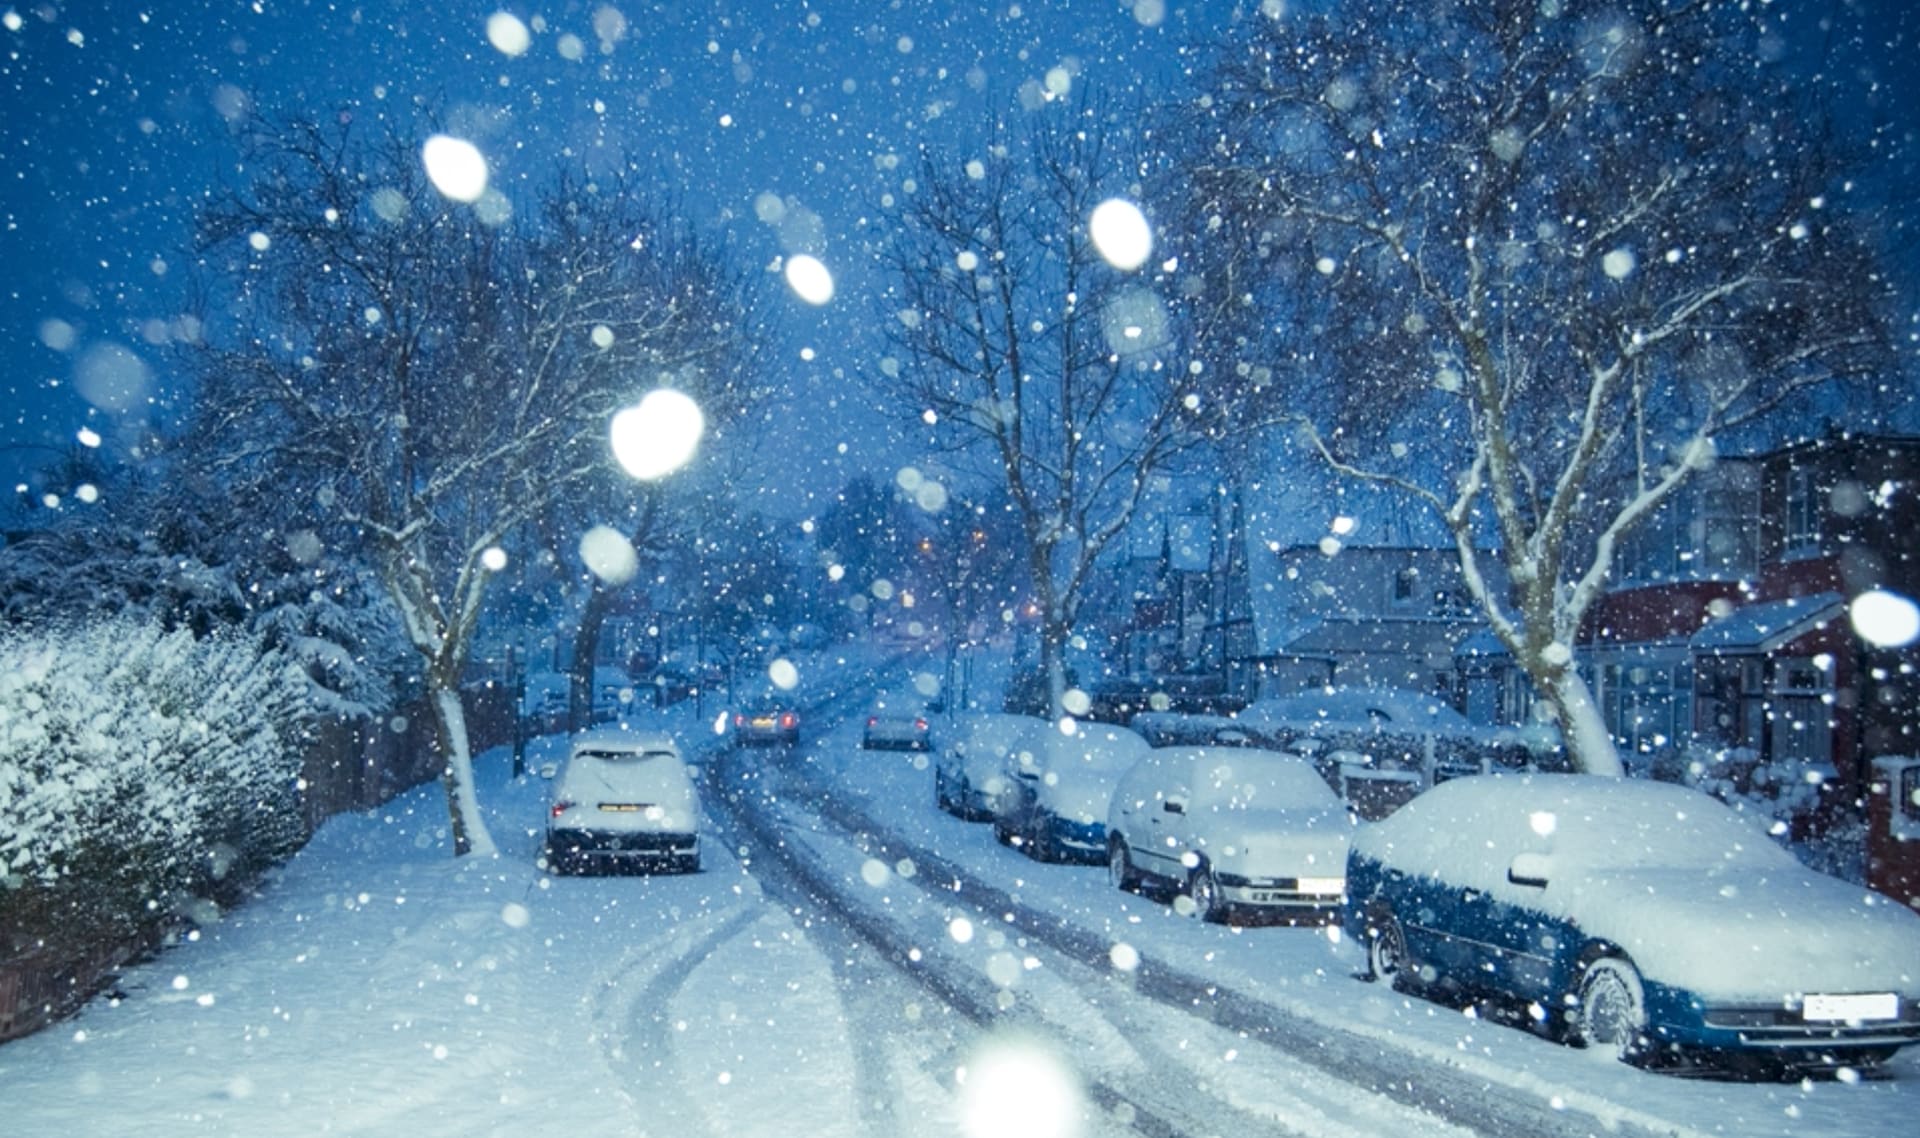
What’s the climate like where you live: is it more like where Doug grew up? Or more like where Shelley grew up? Or something else?
Please wait…
This video is having trouble loading. You may have lost your Internet connection.
Step 1: Click to Reload this page
Step 2: Click to
Try our other video player
Step 3: contact support if trouble persists.
Or,
dismiss this message.
Please wait…
This video is having trouble loading. You may have lost your Internet connection.
Step 1: Click to Reload this page
Step 2: Click to
Try our other video player
Step 3: contact support if trouble persists.
Or,
dismiss this message.
Please wait…
This video is having trouble loading. You may have lost your Internet connection.
Step 1: Click to Reload this page
Step 2: Click to
Try our other video player
Step 3: contact support if trouble persists.
Or,
dismiss this message.
Please wait…
This video is having trouble loading. You may have lost your Internet connection.
Step 1: Click to Reload this page
Step 2: Click to
Try our other video player
Step 3: contact support if trouble persists.
Or,
dismiss this message.
Please wait…
This video is having trouble loading. You may have lost your Internet connection.
Step 1: Click to Reload this page
Step 2: Click to
Try our other video player
Step 3: contact support if trouble persists.
Or,
dismiss this message.
Please wait…
This video is having trouble loading. You may have lost your Internet connection.
Step 1: Click to Reload this page
Step 2: Click to
Try our other video player
Step 3: contact support if trouble persists.
Or,
dismiss this message.
Please wait…
This video is having trouble loading. You may have lost your Internet connection.
Step 1: Click to Reload this page
Step 2: Click to
Try our other video player
Step 3: contact support if trouble persists.
Or,
dismiss this message.
Please wait…
This video is having trouble loading. You may have lost your Internet connection.
Step 1: Click to Reload this page
Step 2: Click to
Try our other video player
Step 3: contact support if trouble persists.
Or,
dismiss this message.
Please wait…
This video is having trouble loading. You may have lost your Internet connection.
Step 1: Click to Reload this page
Step 2: Click to
Try our other video player
Step 3: contact support if trouble persists.
Or,
dismiss this message.
Please wait…
This video is having trouble loading. You may have lost your Internet connection.
Step 1: Click to Reload this page
Step 2: Click to
Try our other video player
Step 3: contact support if trouble persists.
Or,
dismiss this message.
Please wait…
This video is having trouble loading. You may have lost your Internet connection.
Step 1: Click to Reload this page
Step 2: Click to
Try our other video player
Step 3: contact support if trouble persists.
Or,
dismiss this message.
Please wait…
This video is having trouble loading. You may have lost your Internet connection.
Step 1: Click to Reload this page
Step 2: Click to
Try our other video player
Step 3: contact support if trouble persists.
Or,
dismiss this message.
Please wait…
This video is having trouble loading. You may have lost your Internet connection.
Step 1: Click to Reload this page
Step 2: Click to
Try our other video player
Step 3: contact support if trouble persists.
Or,
dismiss this message.
Please wait…
This video is having trouble loading. You may have lost your Internet connection.
Step 1: Click to Reload this page
Step 2: Click to
Try our other video player
Step 3: contact support if trouble persists.
Or,
dismiss this message.
Please wait…
This video is having trouble loading. You may have lost your Internet connection.
Step 1: Click to Reload this page
Step 2: Click to
Try our other video player
Step 3: contact support if trouble persists.
Or,
dismiss this message.
Please wait…
This video is having trouble loading. You may have lost your Internet connection.
Step 1: Click to Reload this page
Step 2: Click to
Try our other video player
Step 3: contact support if trouble persists.
Or,
dismiss this message.
Please wait…
This video is having trouble loading. You may have lost your Internet connection.
Step 1: Click to Reload this page
Step 2: Click to
Try our other video player
Step 3: contact support if trouble persists.
Or,
dismiss this message.
Please wait…
This video is having trouble loading. You may have lost your Internet connection.
Step 1: Click to Reload this page
Step 2: Click to
Try our other video player
Step 3: contact support if trouble persists.
Or,
dismiss this message.
Please wait…
This video is having trouble loading. You may have lost your Internet connection.
Step 1: Click to Reload this page
Step 2: Click to
Try our other video player
Step 3: contact support if trouble persists.
Or,
dismiss this message.
Please wait…
This video is having trouble loading. You may have lost your Internet connection.
Step 1: Click to Reload this page
Step 2: Click to
Try our other video player
Step 3: contact support if trouble persists.
Or,
dismiss this message.
DISCUSS:
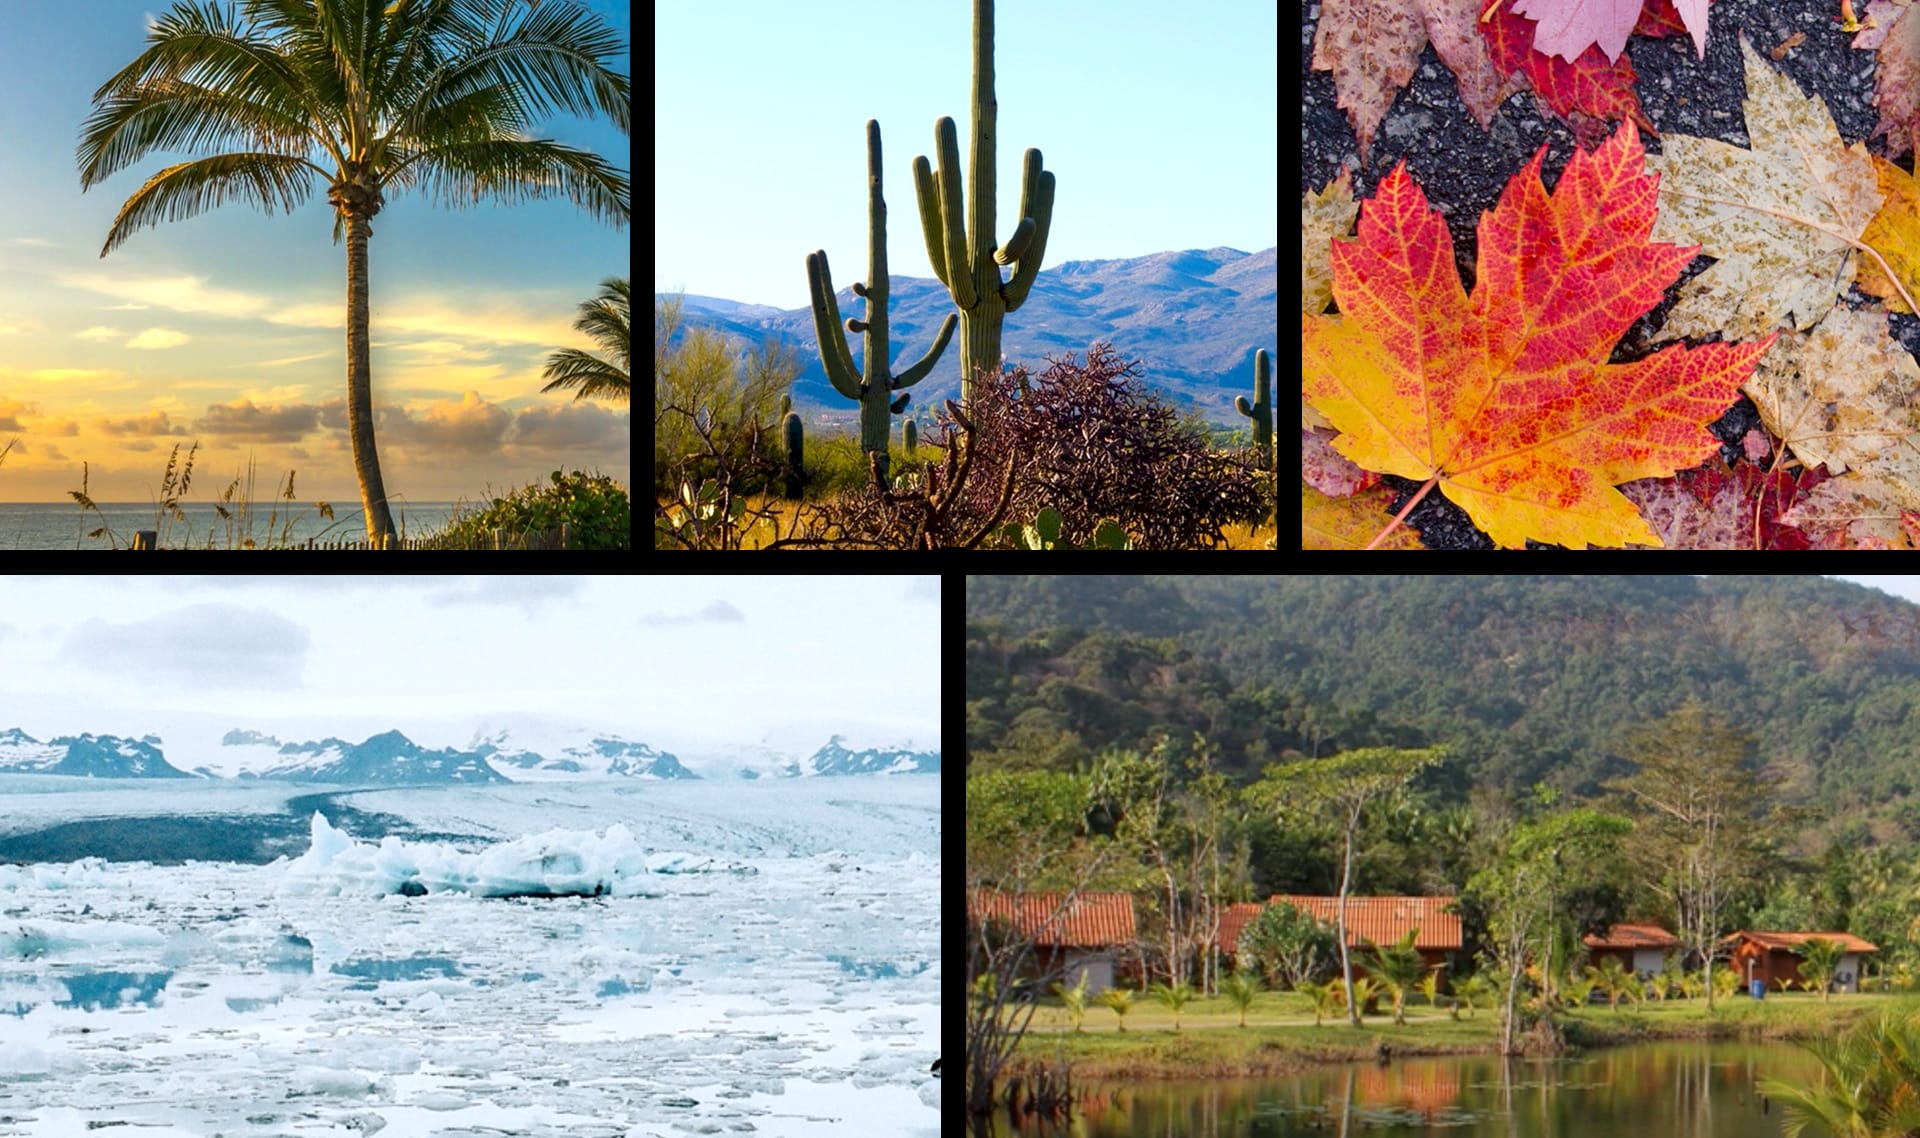
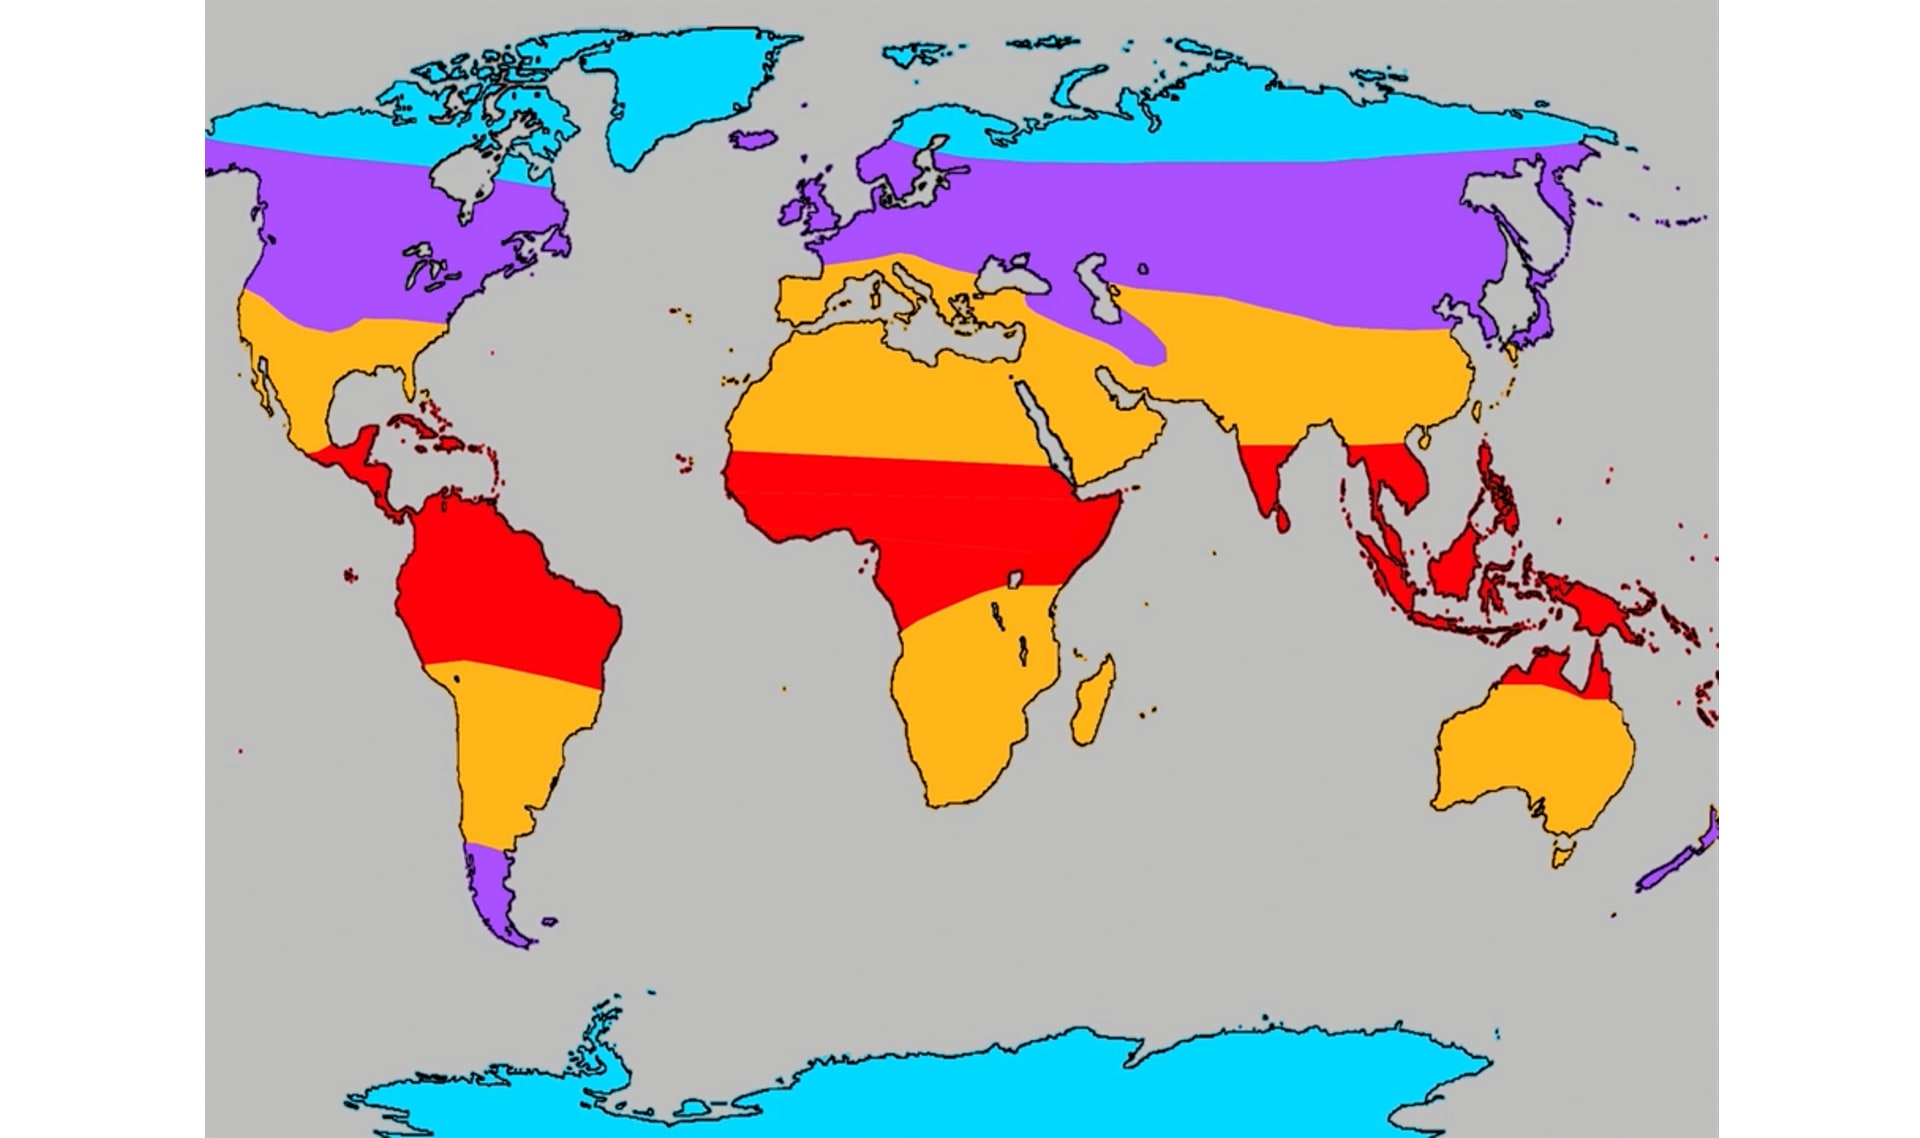
What kind of weather, plants, and animals do you think the orange and purple zones have? Why do you think that?
Please wait…
This video is having trouble loading. You may have lost your Internet connection.
Step 1: Click to Reload this page
Step 2: Click to
Try our other video player
Step 3: contact support if trouble persists.
Or,
dismiss this message.
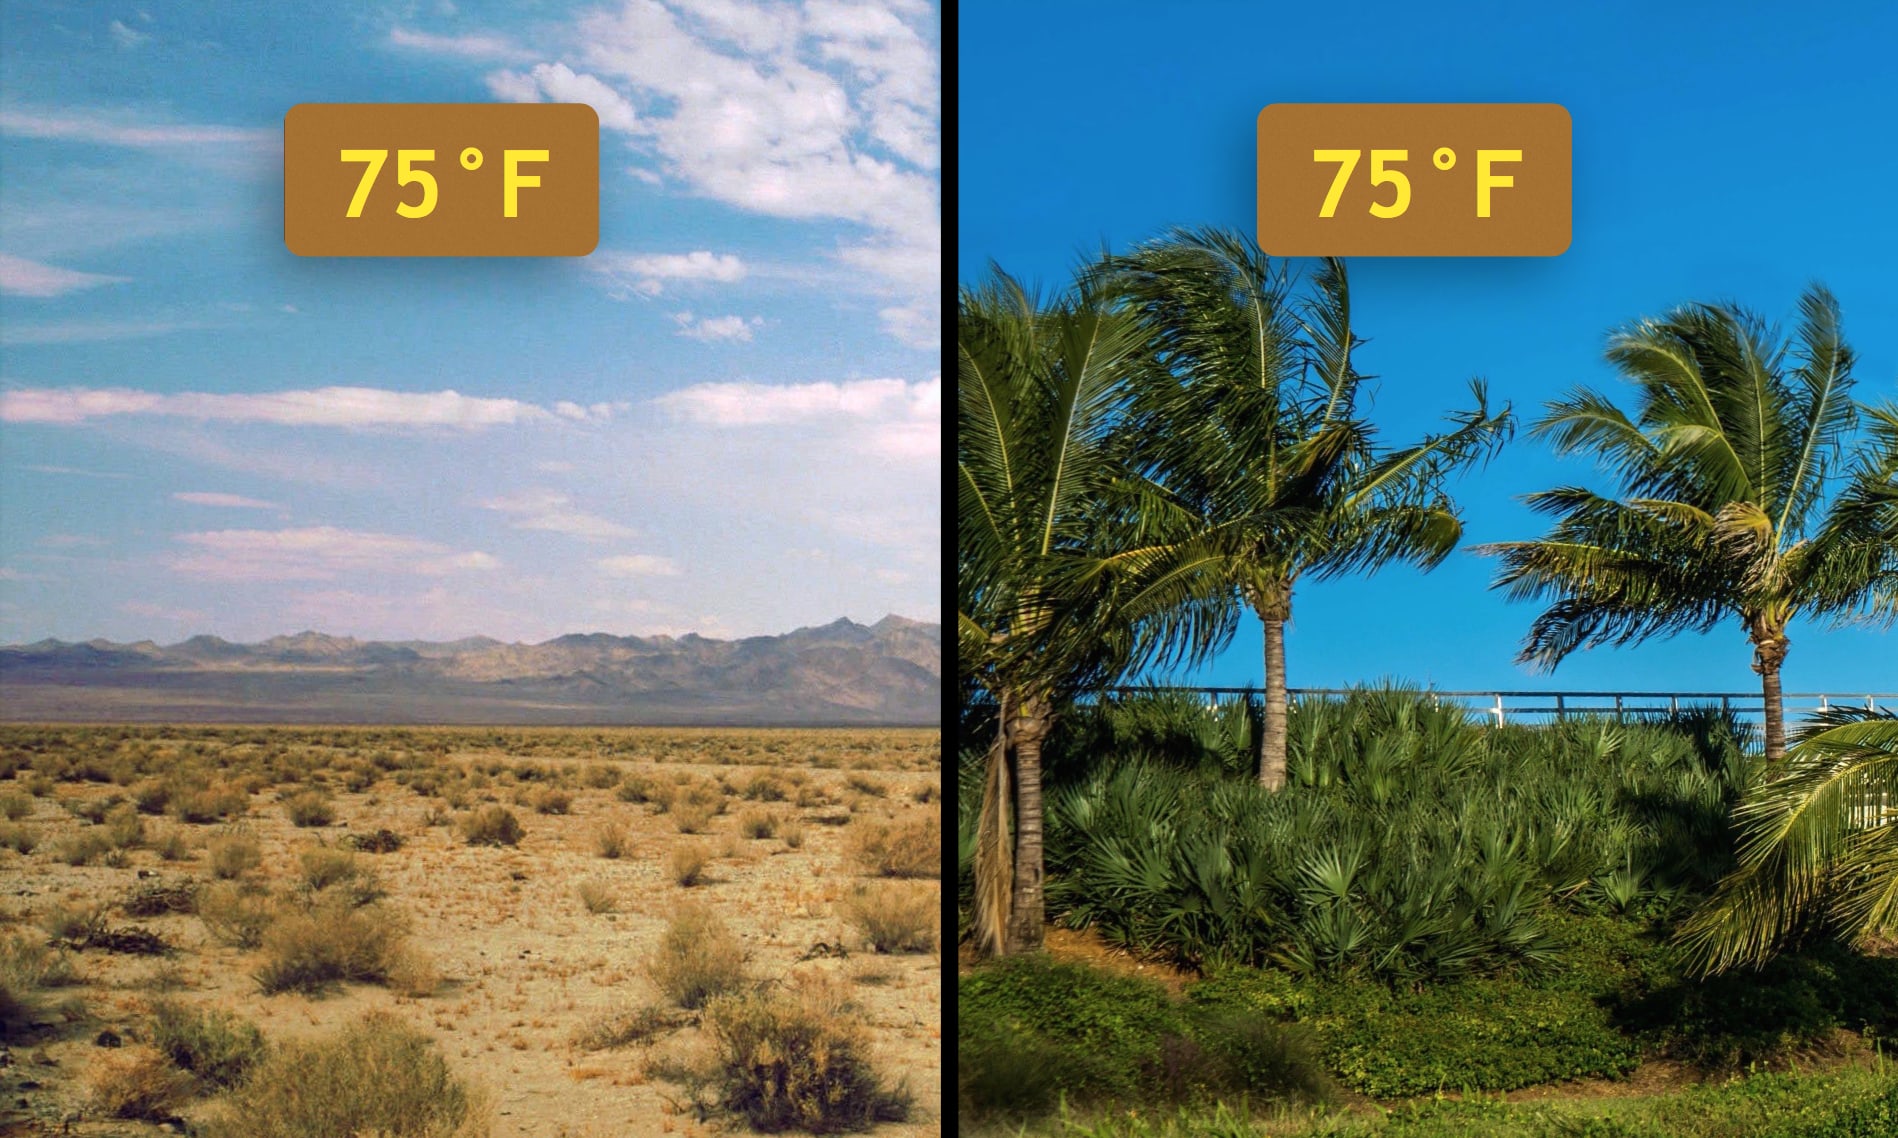
DISCUSS: These two places have the same temperatures throughout the year... so why do they look so different?
Do you have any ideas?
Please wait…
This video is having trouble loading. You may have lost your Internet connection.
Step 1: Click to Reload this page
Step 2: Click to
Try our other video player
Step 3: contact support if trouble persists.
Or,
dismiss this message.
DISCUSS:
(1) Which climate zones have you been to?
(2) Which ones would you want to visit?
Please wait…
This video is having trouble loading. You may have lost your Internet connection.
Step 1: Click to Reload this page
Step 2: Click to
Try our other video player
Step 3: contact support if trouble persists.
Or,
dismiss this message.
Please wait…
This video is having trouble loading. You may have lost your Internet connection.
Step 1: Click to Reload this page
Step 2: Click to
Try our other video player
Step 3: contact support if trouble persists.
Or,
dismiss this message.
Please wait…
This video is having trouble loading. You may have lost your Internet connection.
Step 1: Click to Reload this page
Step 2: Click to
Try our other video player
Step 3: contact support if trouble persists.
Or,
dismiss this message.
Please wait…
This video is having trouble loading. You may have lost your Internet connection.
Step 1: Click to Reload this page
Step 2: Click to
Try our other video player
Step 3: contact support if trouble persists.
Or,
dismiss this message.

Please wait…
This video is having trouble loading. You may have lost your Internet connection.
Step 1: Click to Reload this page
Step 2: Click to
Try our other video player
Step 3: contact support if trouble persists.
Or,
dismiss this message.
season
1 of 13
a time of year with specific weather that repeats every year
summer
2 of 13
one of the four seasons, the warmest season in some places
winter
3 of 13
one of the four seasons, the coldest season in some places
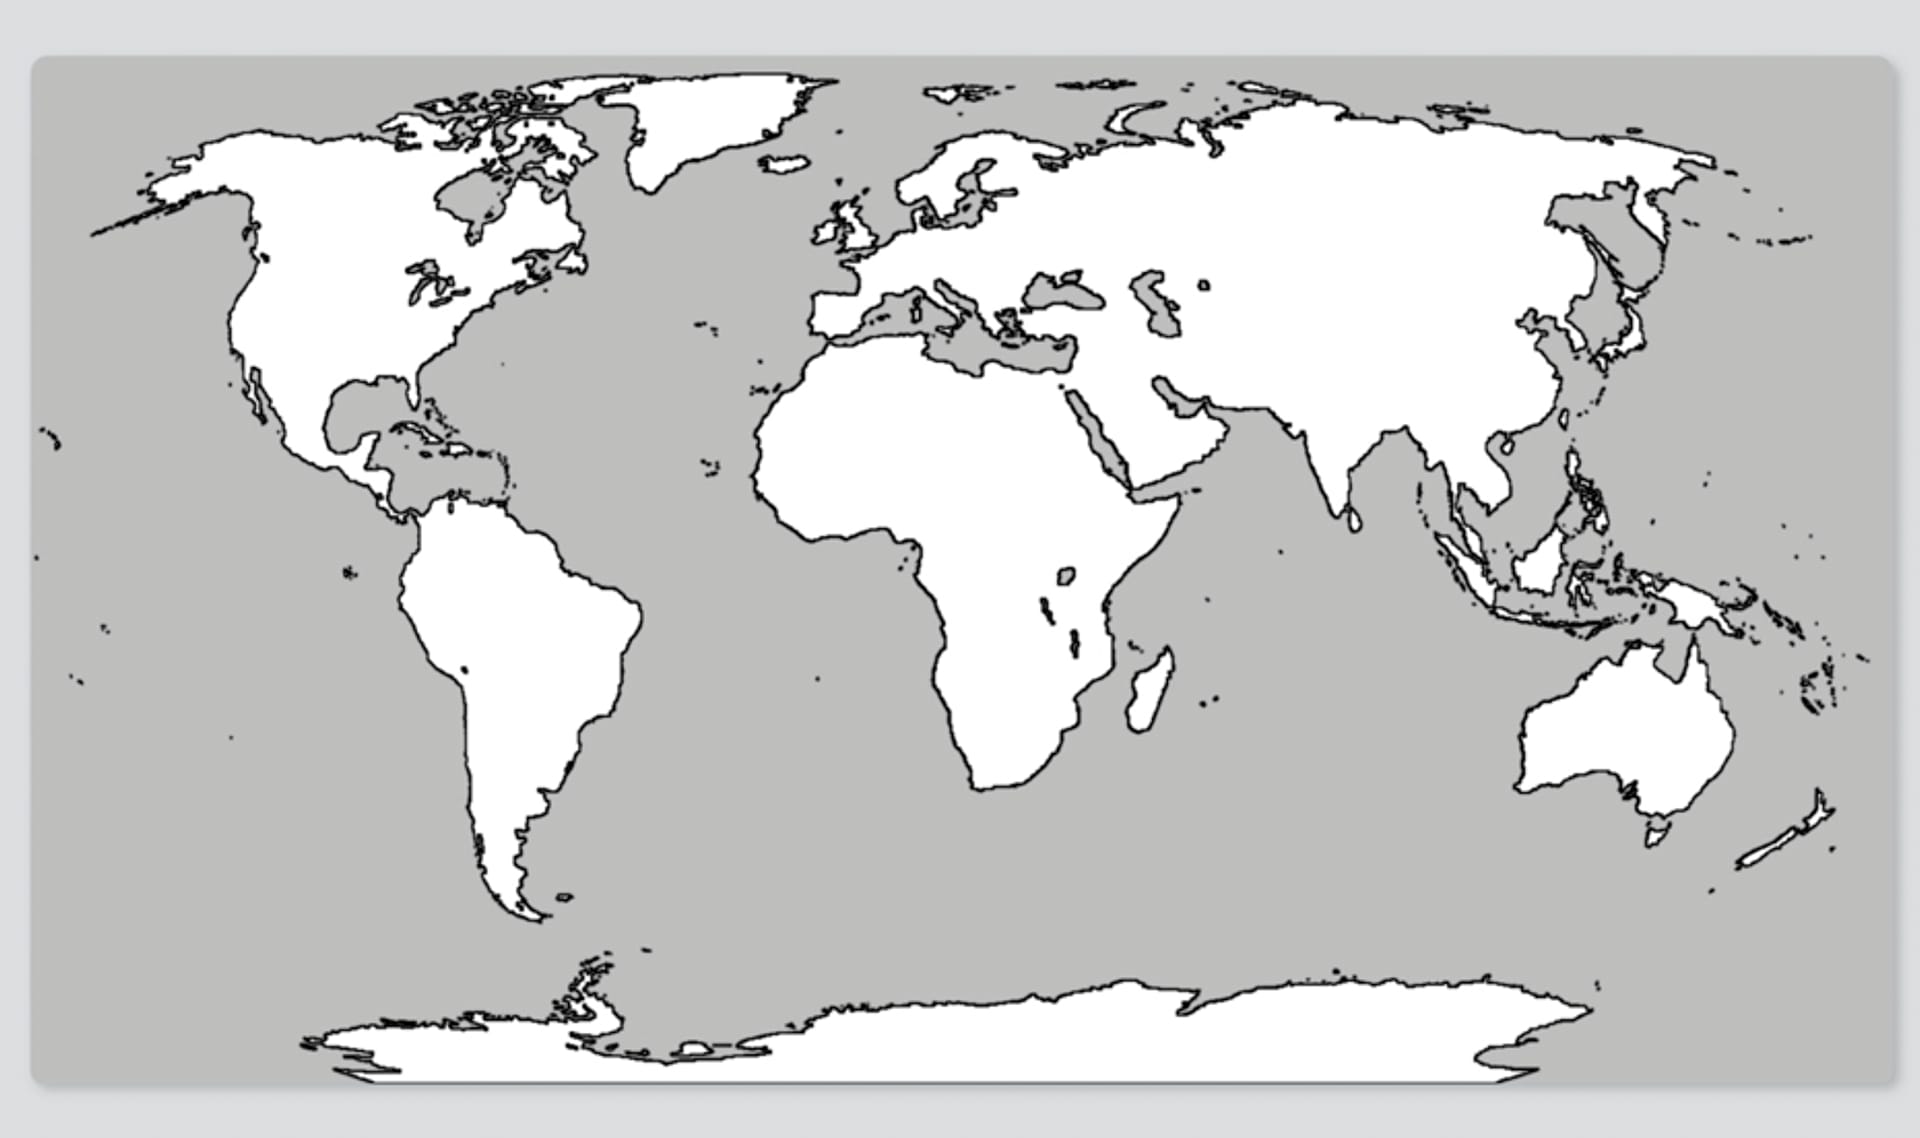
map
4 of 13
a picture that shows the features of a place and where those features are
climate
5 of 13
the weather conditions in an area that are similar year after year
pattern
6 of 13
something that happens again and again and again in a way that can be predicted
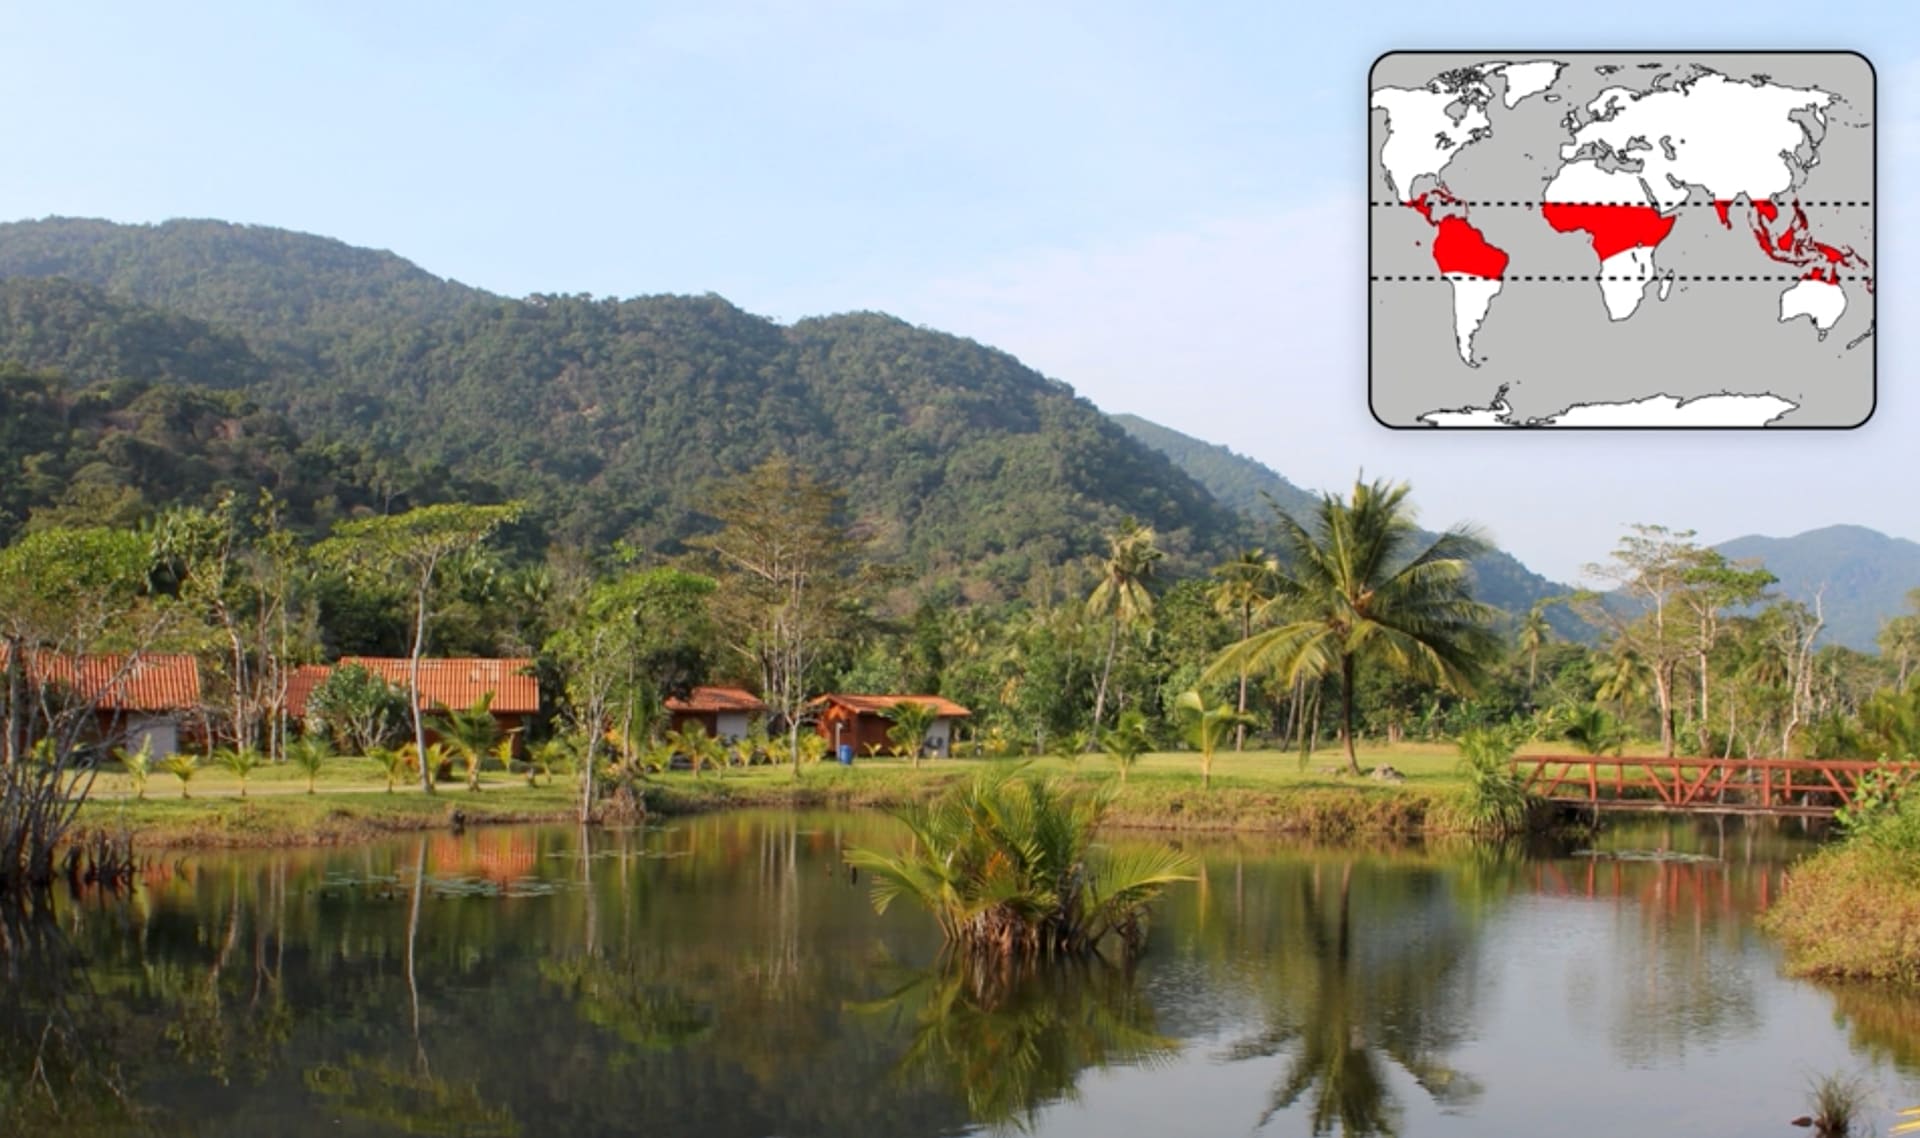
tropical climate
7 of 13
climate that is hot all year long
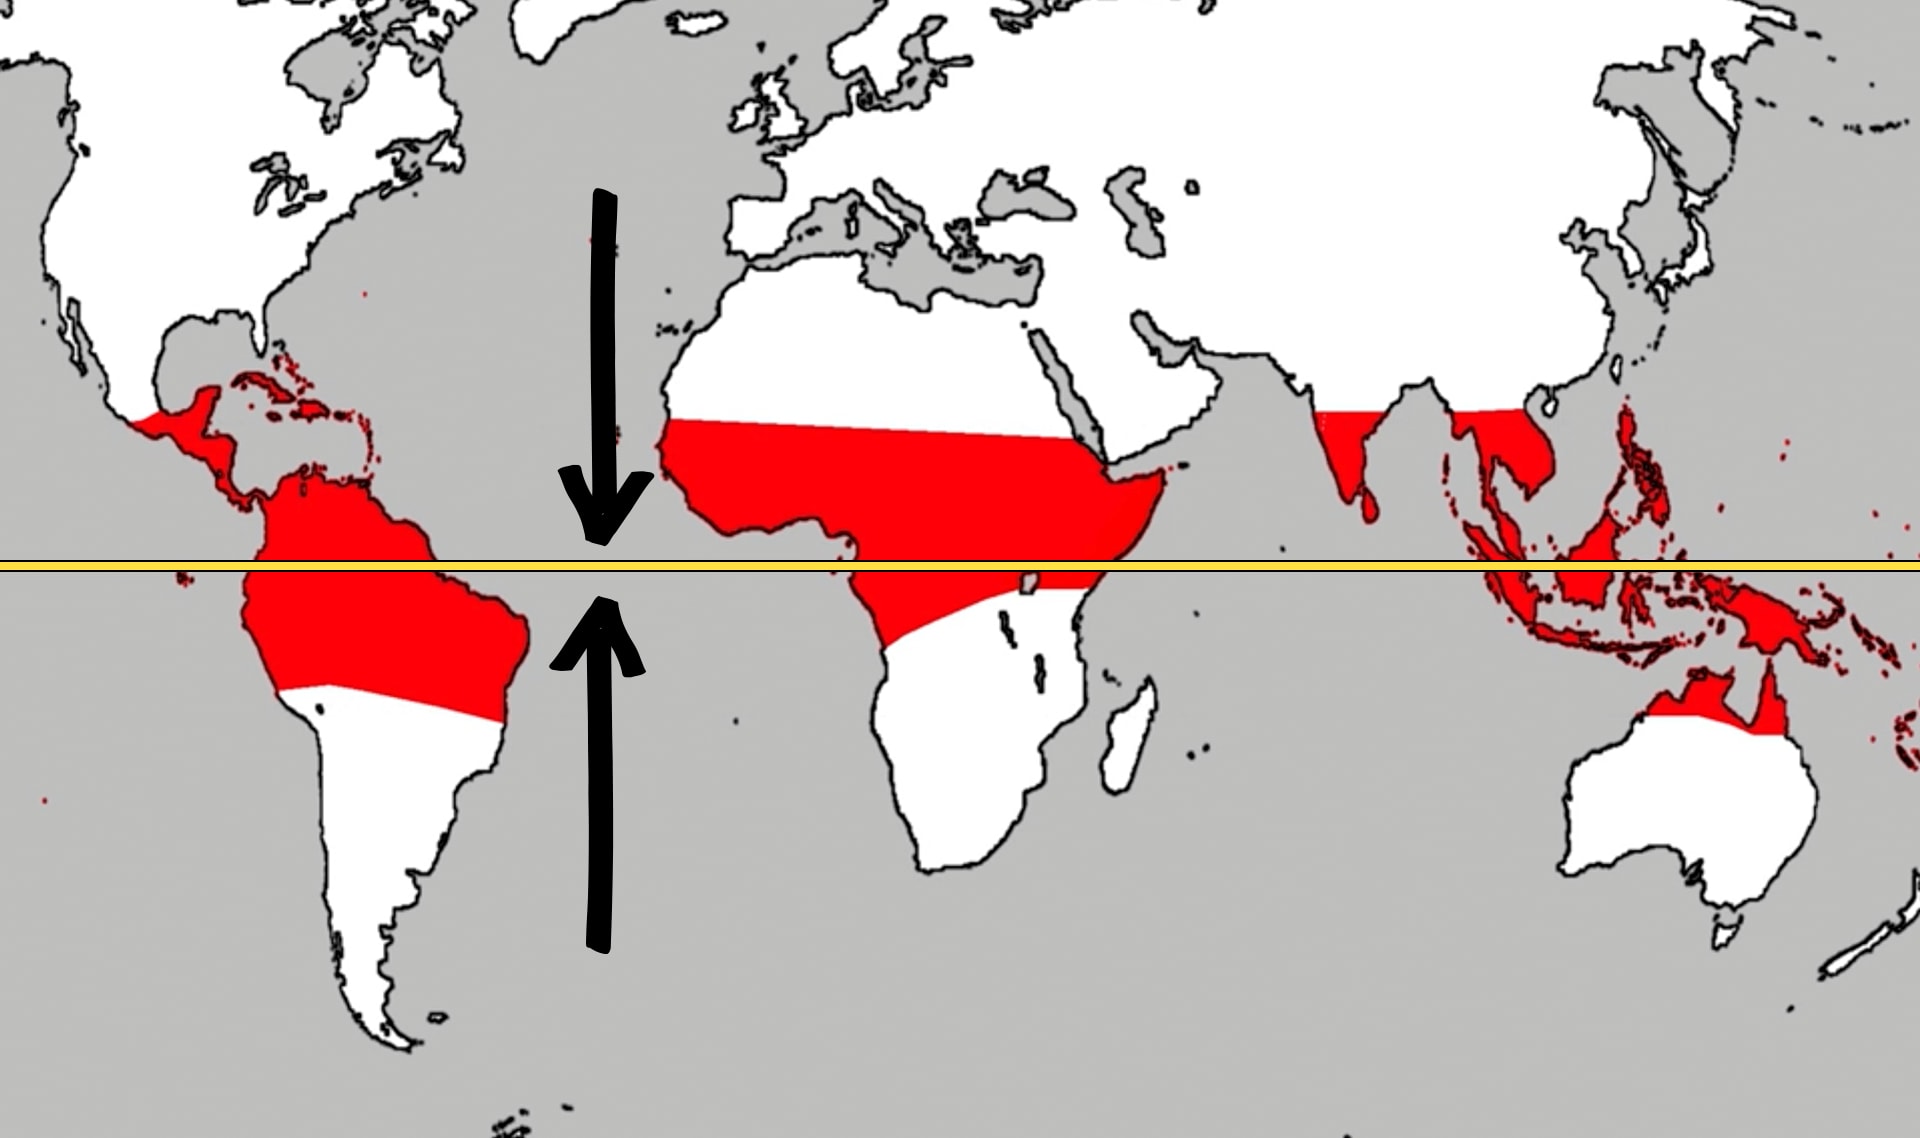
equator
8 of 13
an imaginary line drawn around the middle of the Earth where tropical climates are found

mild climate
9 of 13
climate that is warm during the winter and hot during the summer
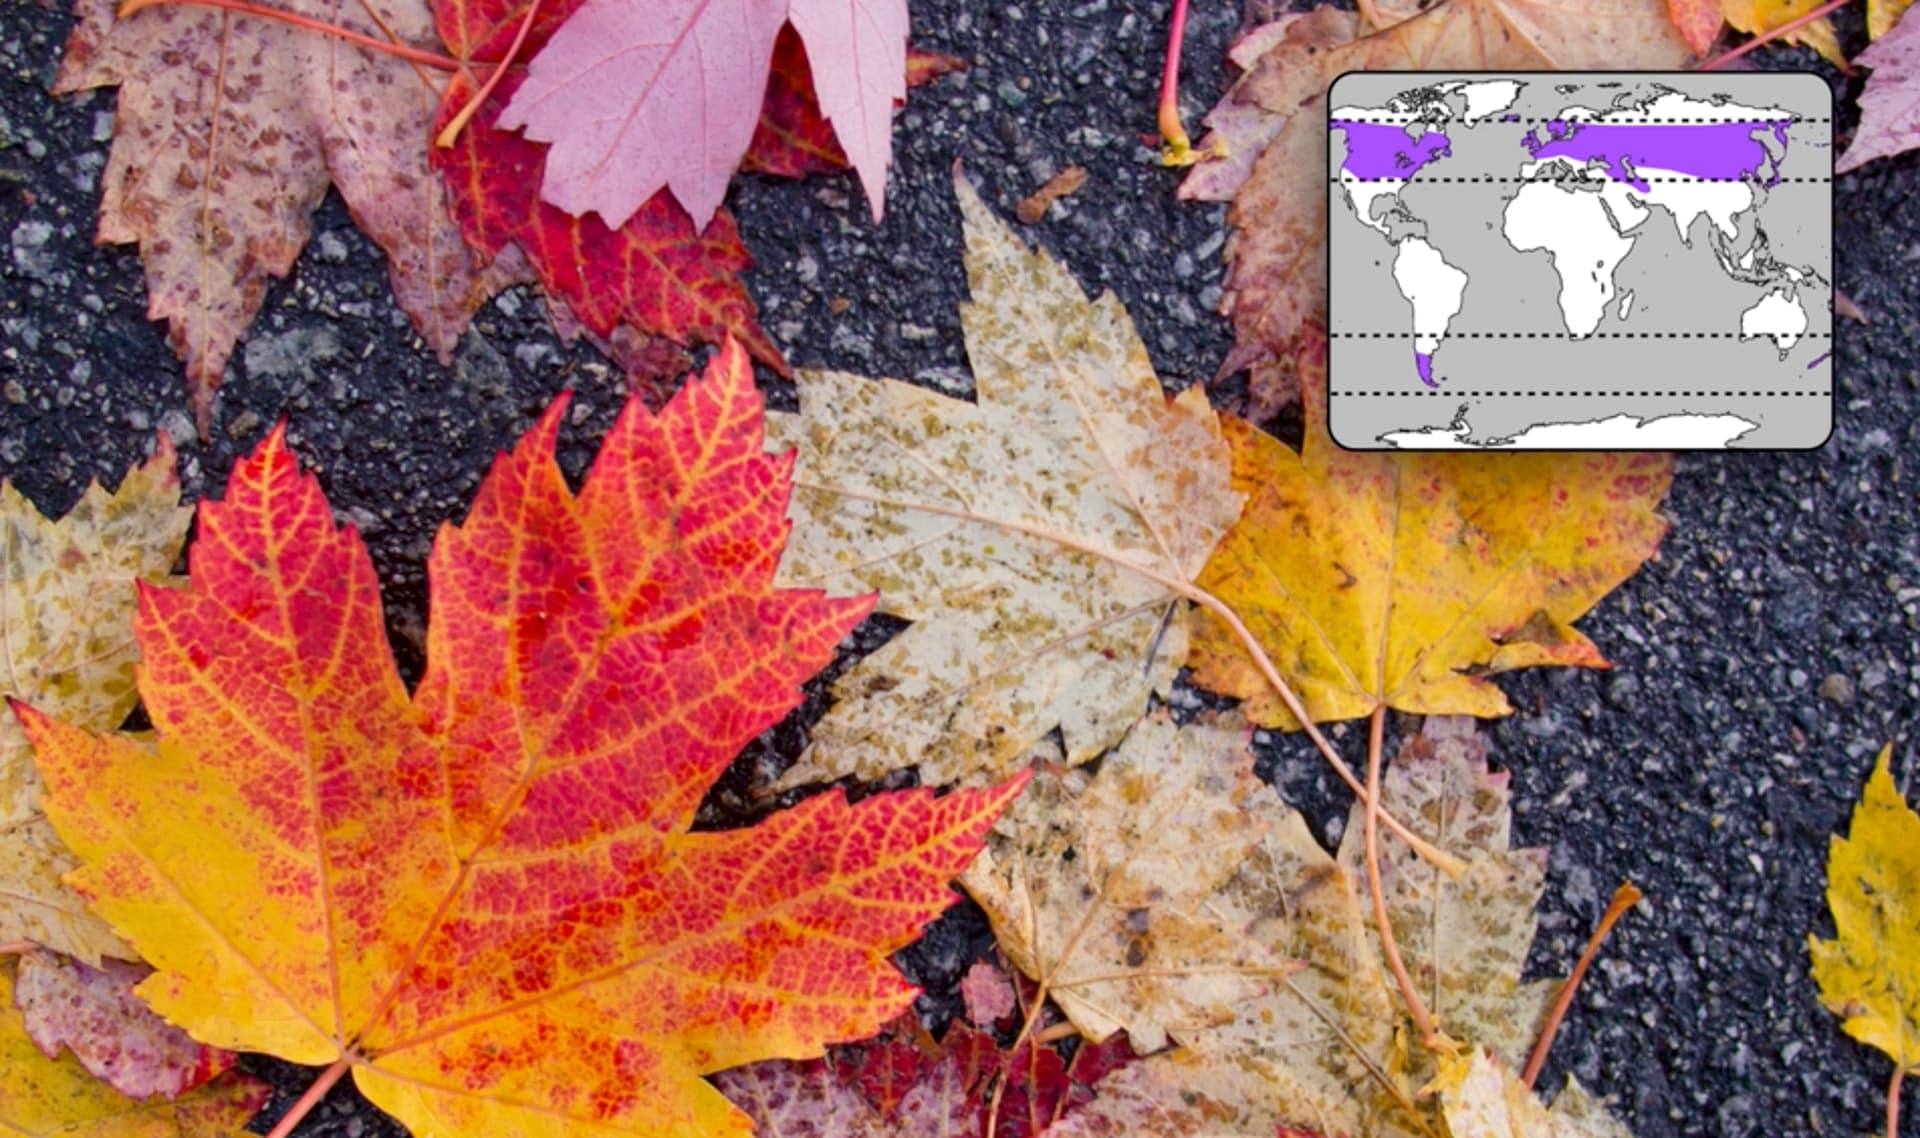
continental climate
10 of 13
climate that is cold in the winter and hot during the summer
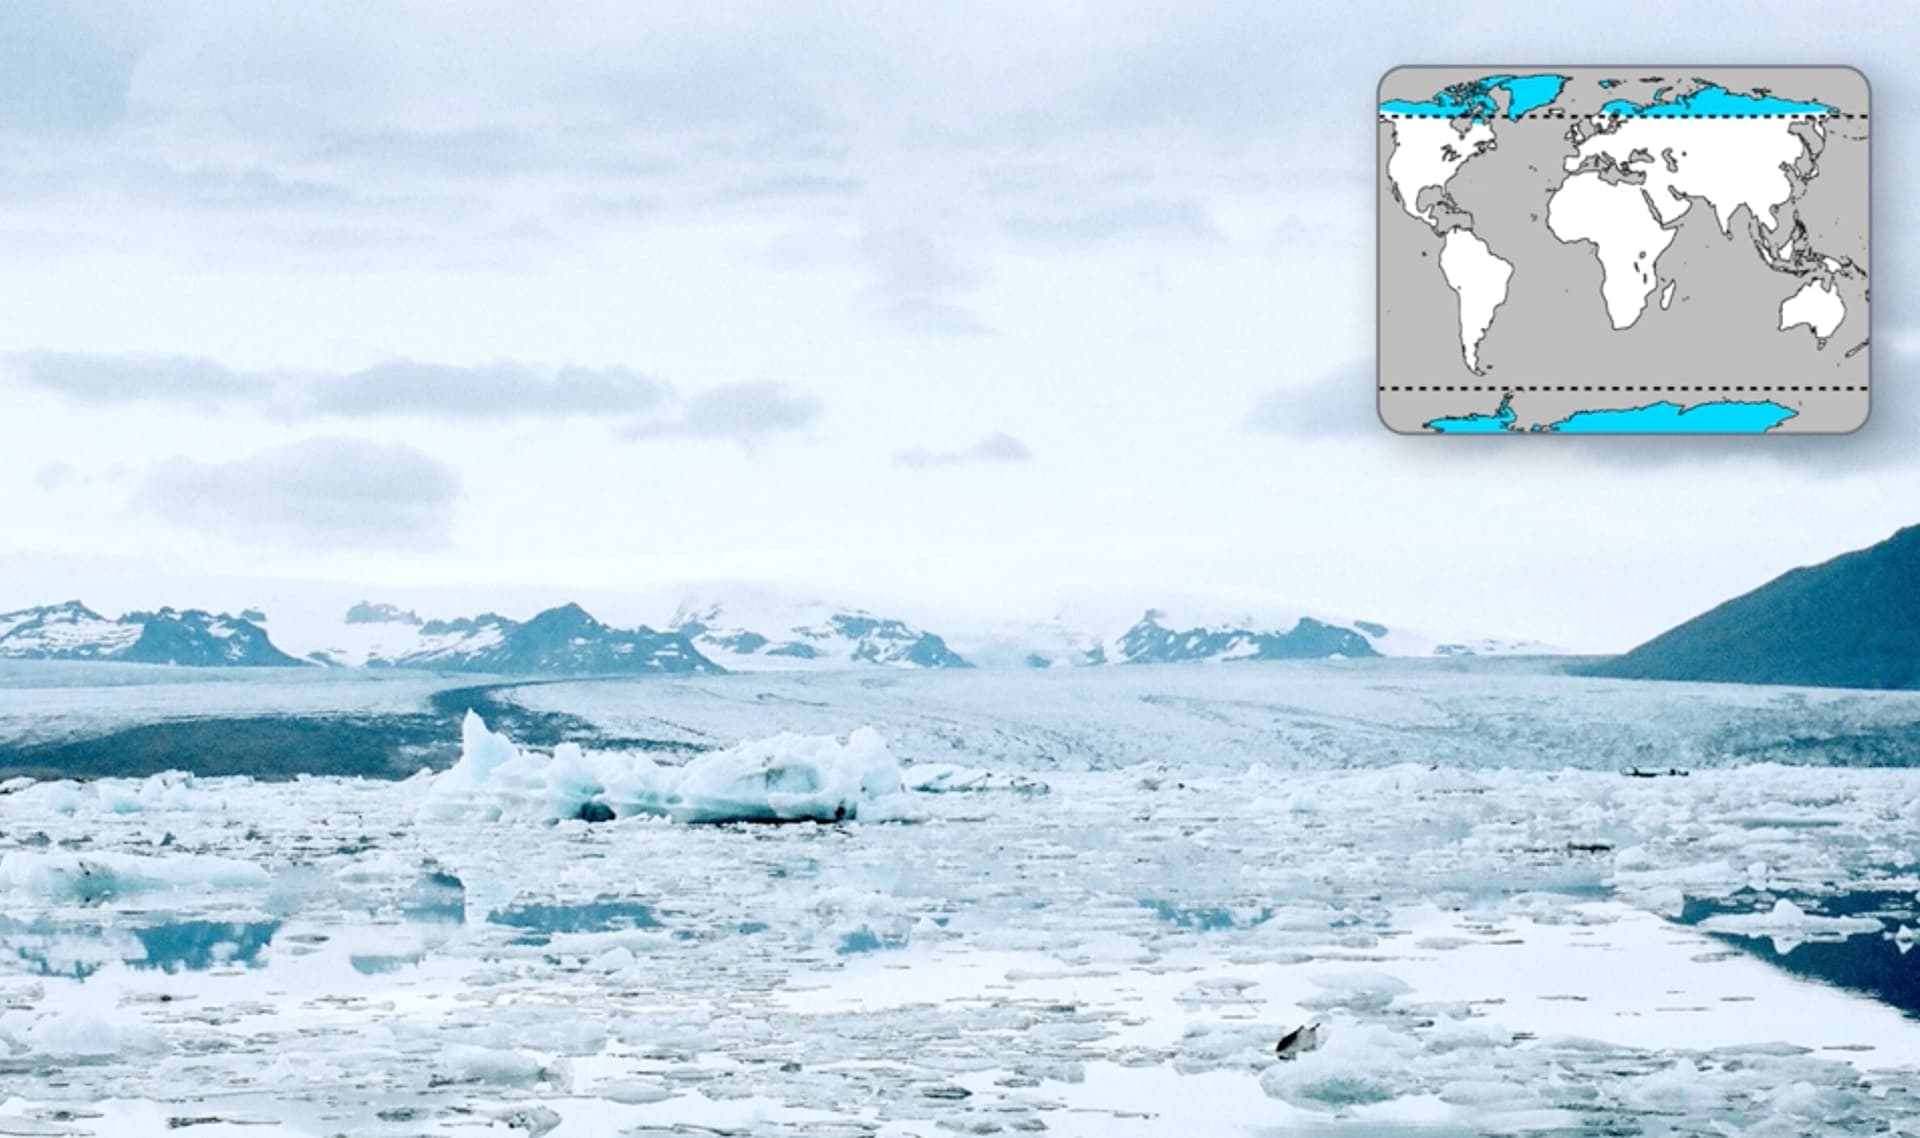
polar climate
11 of 13
climate that is cold all year long
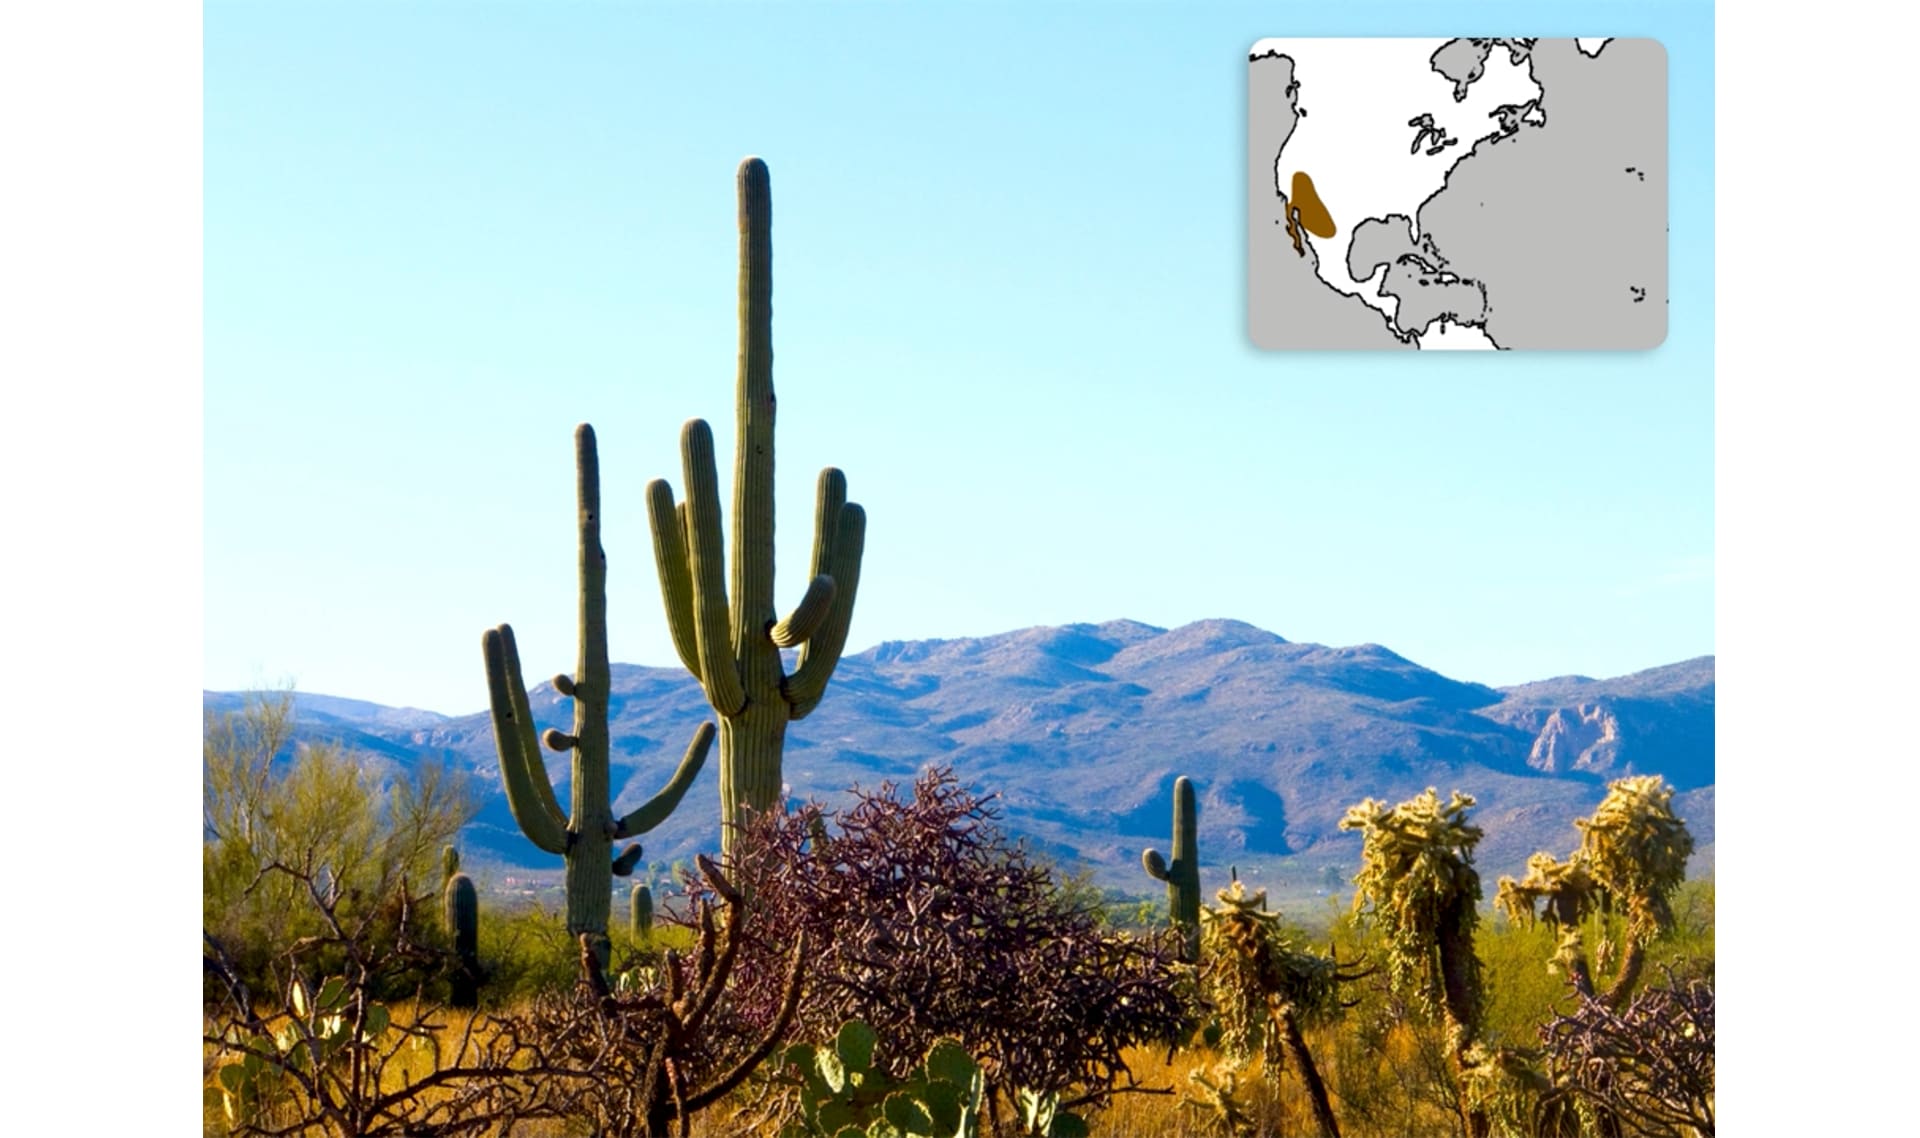
dry climate (desert climate)
12 of 13
climate that does not get a lot of rain
Please wait…
This video is having trouble loading. You may have lost your Internet connection.
Step 1: Click to Reload this page
Step 2: Click to
Try our other video player
Step 3: contact support if trouble persists.
Or,
dismiss this message.
evaporation
13 of 13
the process of a liquid changing to a gas
🎉
That’s it for this lesson! How did it go?
Sign up now for more great lessons!